Rosette chart is a feature that shows multiple different normalized metrics of it’s dataset, including Reanalyses, Citations, Views, Downloads and Connections.
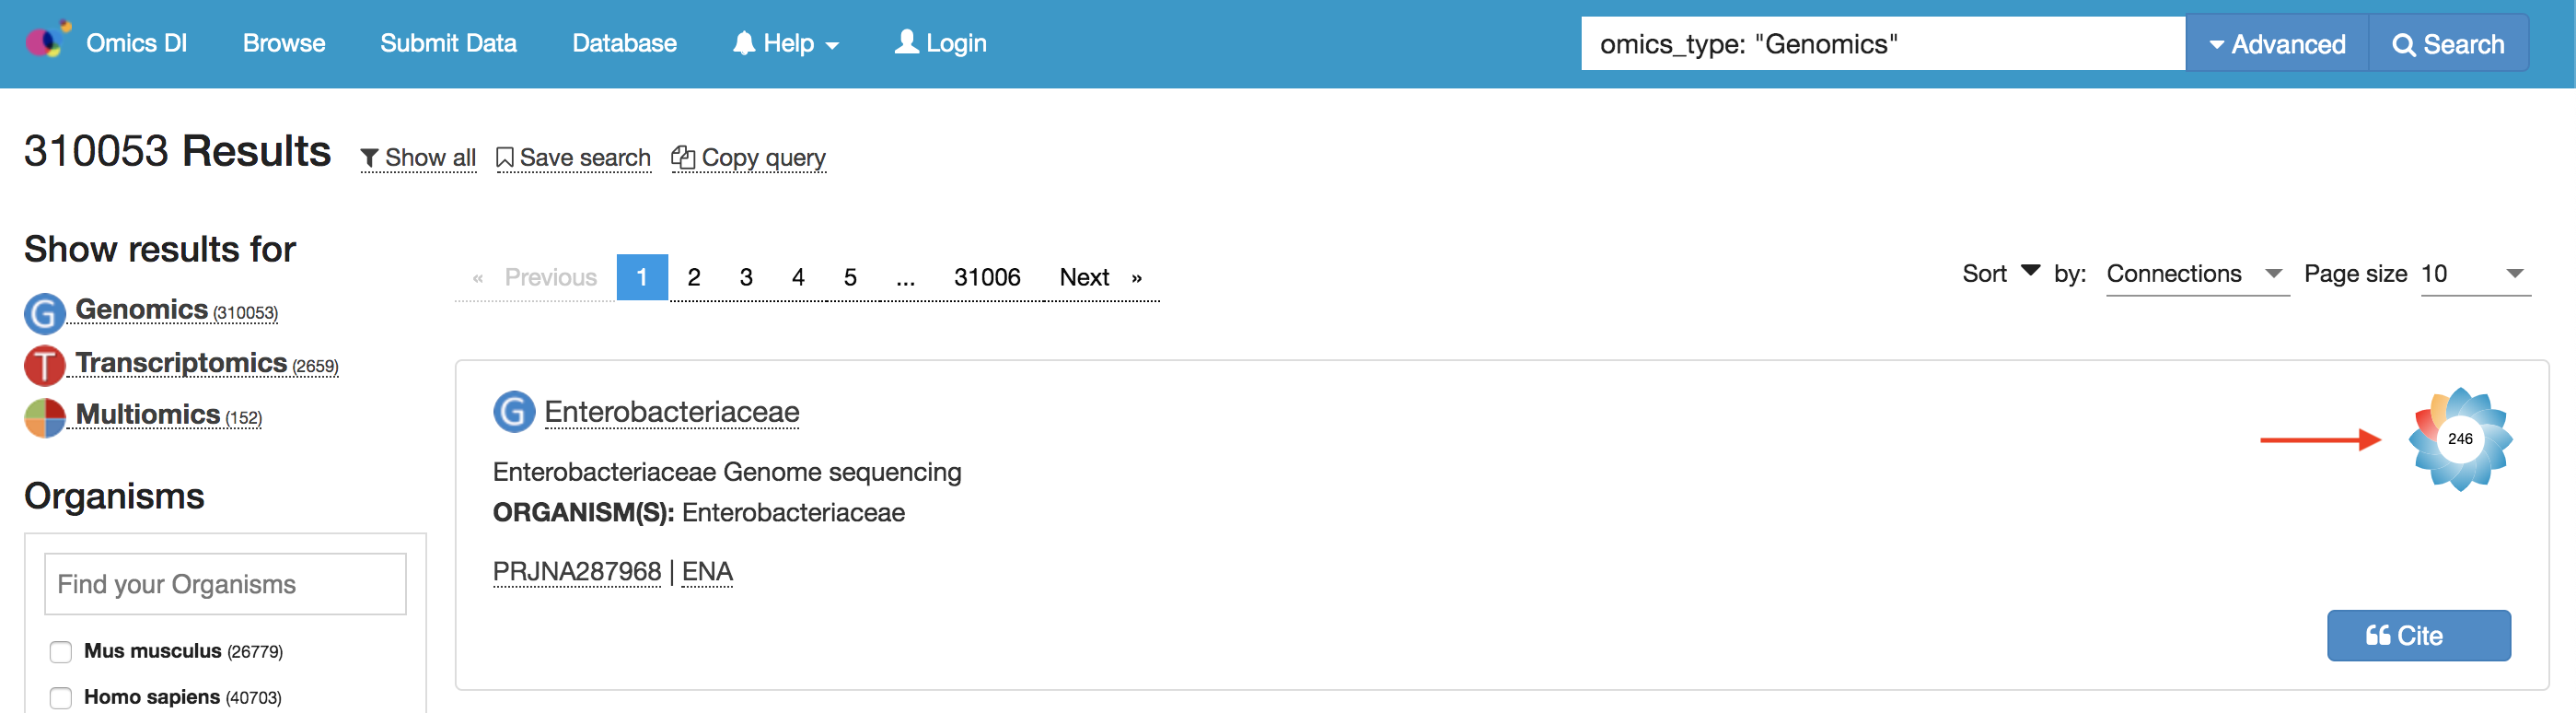
With this feature, we can see how much attention people are giving to this dataset by just a quick look. The chart can be found at the search’s result:
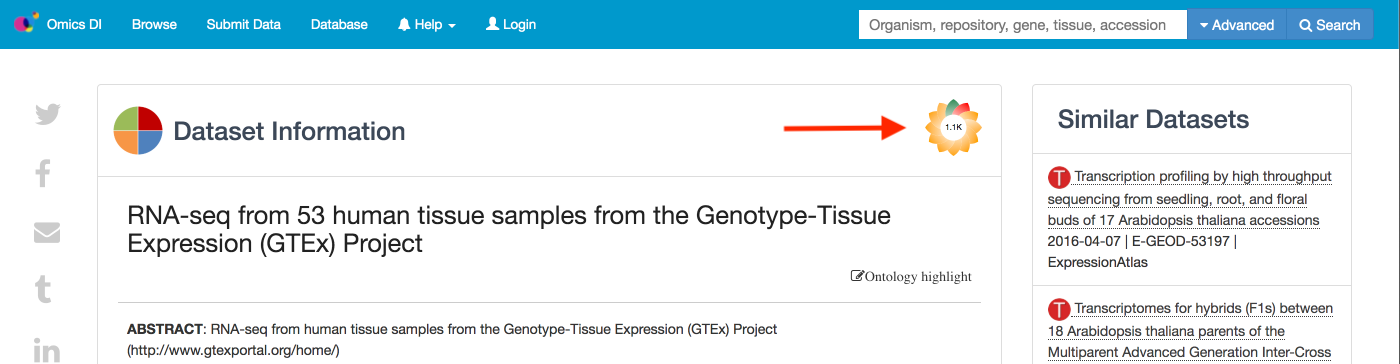
Or in the dataset’s details page:
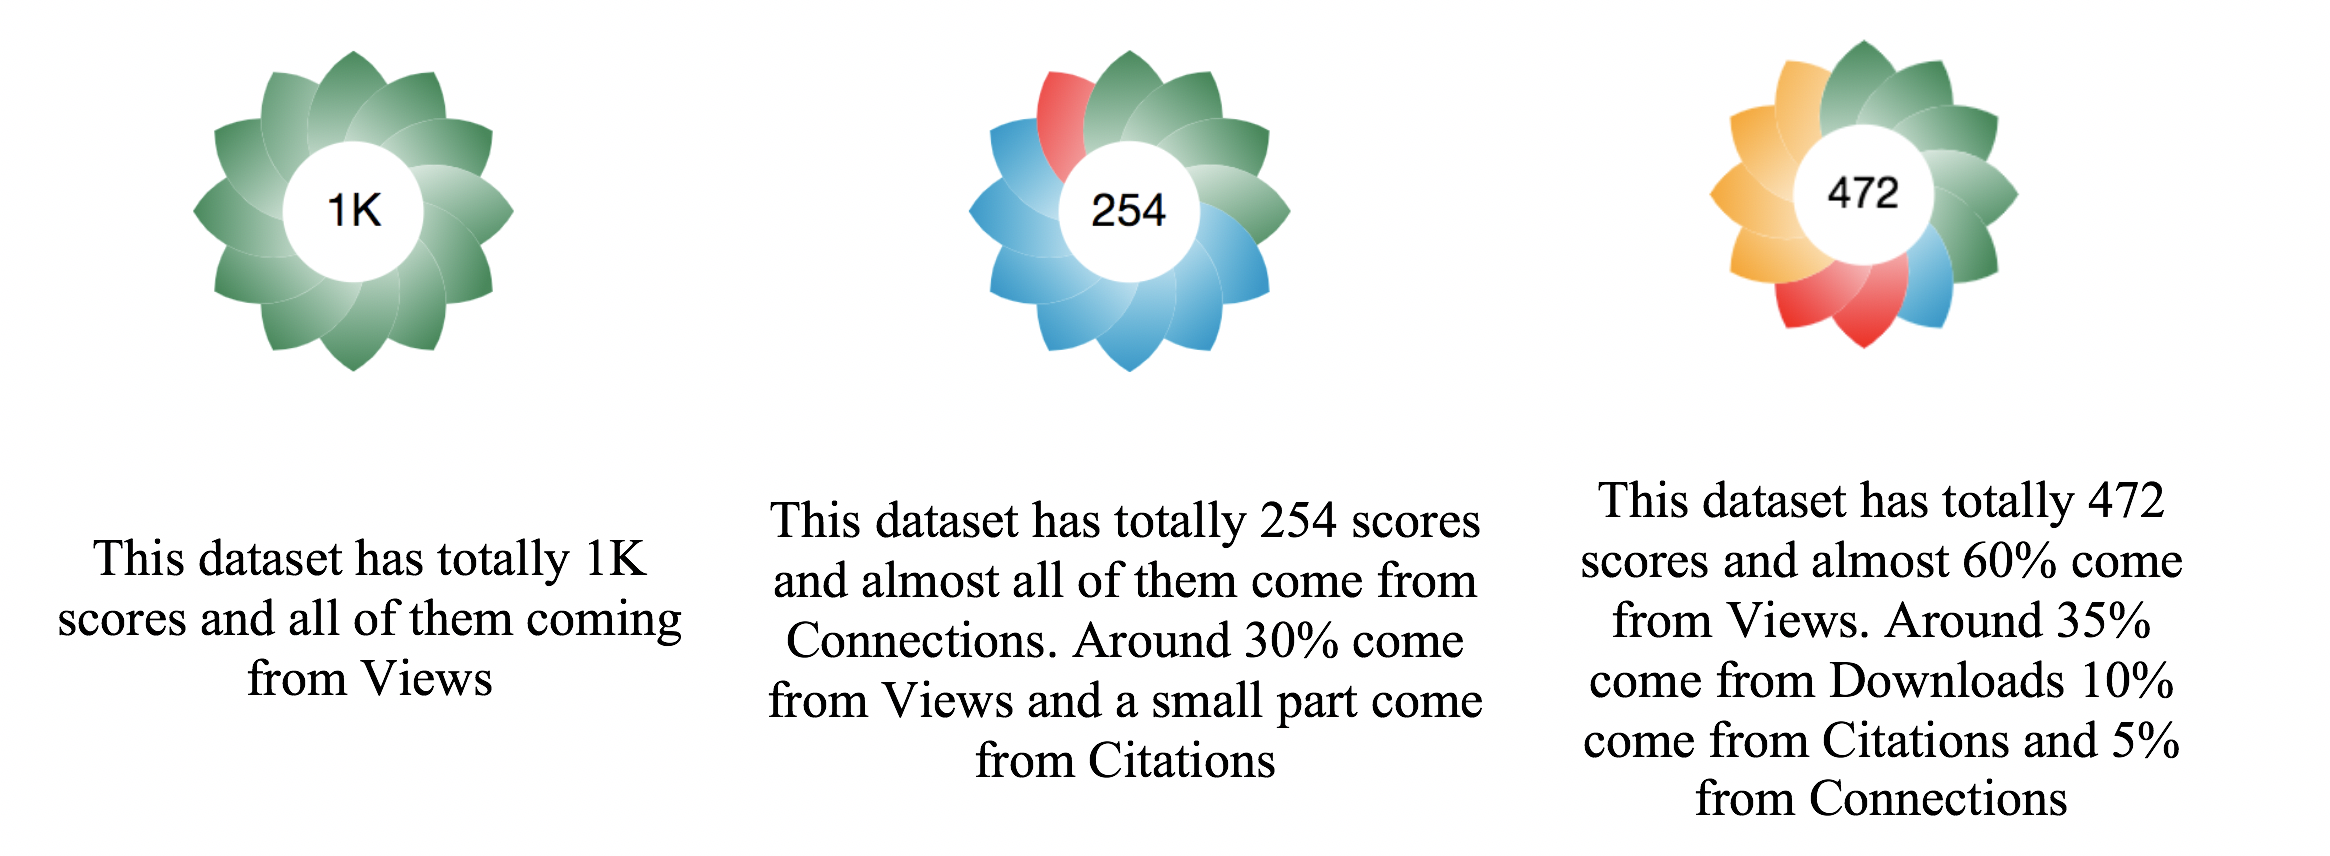
The colour of each of the leaves in the flower is representing a different type of the dataset metrics:
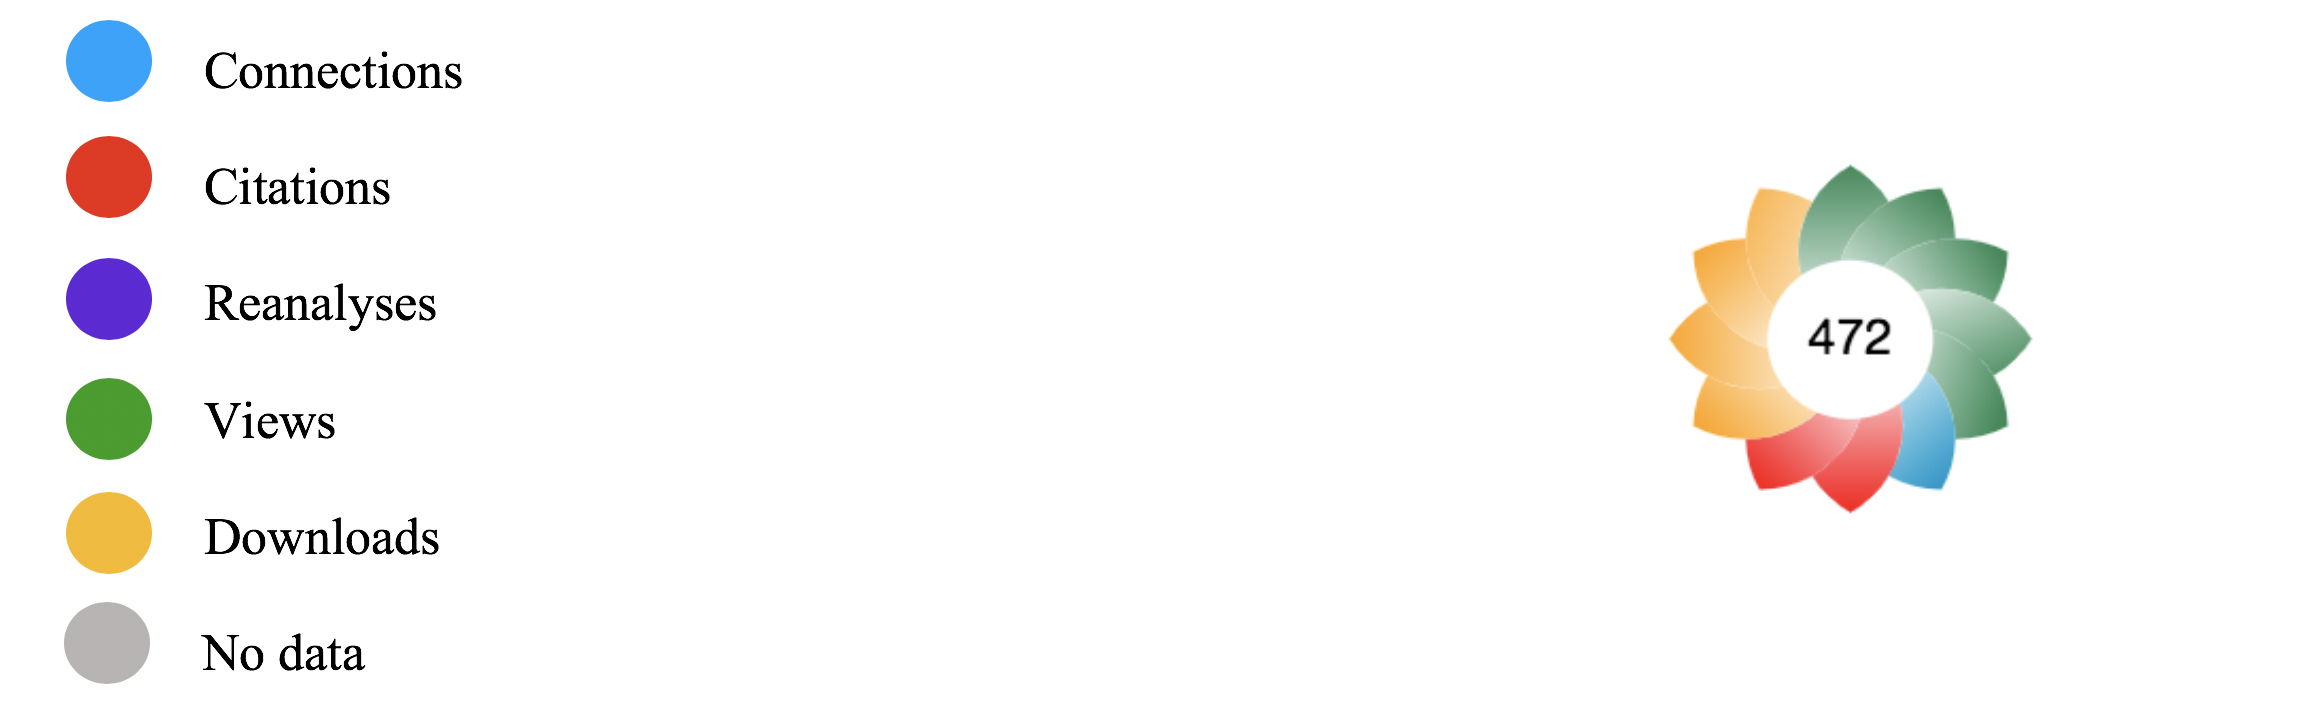
The intensity of the colour leaves in the flower will change depending on the value of the metric with respect to all datasets. Below is some of the samples for comparing the attention score between different datasets:
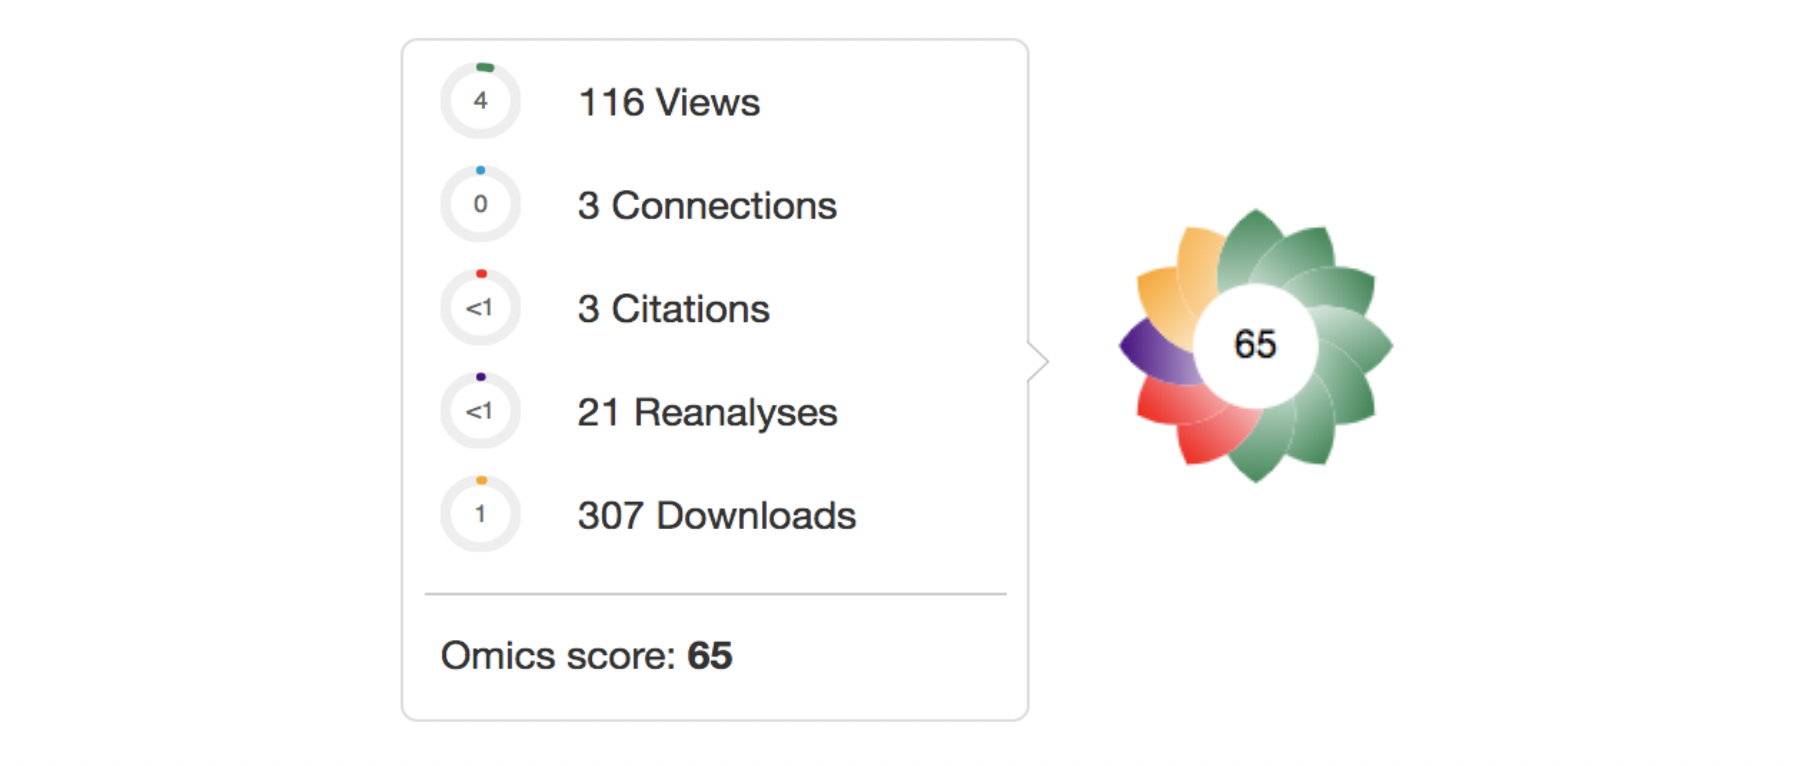
The number in the centre of the Rosette’s shows the aggregated score (Omics score), which represent how much attention the people are giving to this dataset. The Omics score is computed using all the normalized metrics, including Reanalyses (P), Citations (Ci), Views (V), Downloads (D) and Connections (Co). The formula for this metric will be estimated as described in the equation below:
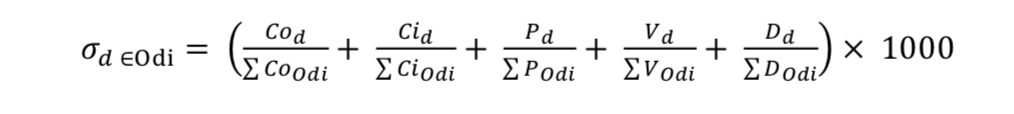 Where d is a dataset belonging to Omics DI database (Odi).
To get the actual number of the dataset’s metric, hovering the mouse to anywhere inside the chart. A tooltip with the actual value as well as it’s normalised value (in percent) will appear: